
Glowworm Swarm Optimization
Ethanol source localization
An odor source localization experiment using a set of sensors was carried out in order to evaluate the validity of the proposed approaches in a realistic environment. An ethanol source, shown in Figure 1(a) was used for all of these experiments. An air pump was used to force air bubbles through ethanol, so as to increase the strength of the source. A fan was used in simulate the presence of wind. A set of four Figaro TGS-822 gas sensors, shown in Figure 1(b) were used to measure ethanol concentrations. These sensors are designed for the detection of organic solvent vapors. Experiments were carried out on a field of size 1.5m X 1.5m.
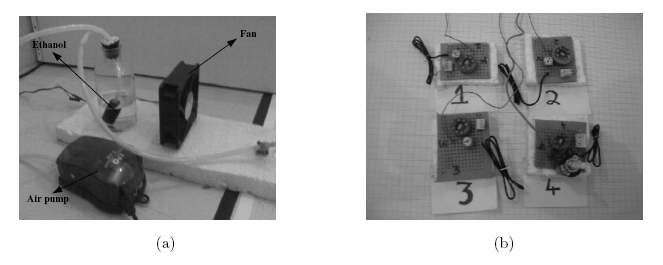
Figure 1: (a) The ethanol source used in the experiments and the fan used to create a unidirectional air flow. (b) The set of sensors used for the experiments
The output characteristics of individual odor sensors are seen to vary due to manufacturing imperfections. Hence the sensors need to be calibrated prior to experimentation. The variation in output characteristics of the odor sensors can be clearly seen from Figure 2(a). Here the voltage output of two gas sensors are plotted with time. These gas sensors were placed very close to each other and hence are expected to have similar outputs. However, as they are not calibrated, their output voltages are different. The gas sensors were calibrated by adding a variable resistance to the sensor circuit and adjusting it until the output of the sensors match. Figure 2(b) shows the output of the gas sensors after calibration. They are seen to overlapping as expected.

Figure 2: Calibration of odor sensors (a) The output of a pair of odor sensors prior to calibration. (b) The output of the same pair of odor sensors after calibration.
Experiments were carried out in the presence of a unidirectional wind and under no wind conditions. The sensors were initially placed at random locations within the field. The GSO algorithm was applied to the gas sensor output values. The communication range for the GSO algorithm was assumed large, to ensure global communication. A step size of 5cm was used. The ethanol source was placed at (40,100). All gas sensors were calibrated so as to obtain a zero concentration output voltage of 1.8V. Gas sensors usually have a cap with a flame-proof stainless steel gauze. This cap was removed for the experiments (as recommended in D. Martinez, O. Rochel, and E. Hugues, "A biomimetic robot for tracking specific odors in turbulent plumes," Autonomous Robots, vol. 20, no. 3, pp. 185-195, 2006.) so as to improve the response time of the sensor.

Table 1: The coordinates and output of the gas sensors at each step in the ethanol source localization experiment.
The measured voltage output of the gas sensors are input to the modified GSO algorithm. The algorithm then provided new coordinates for the gas sensors based on gas sensor output and current coordinate. The sensors were then manually moved to the new location. Then the gas sensor output at the new location is noted and the GSO algorithm is used to evaluate the next location. This is repeated until a majority of the sensors converge to the odor source location. Obstacle avoidance maneuvers are also used. Table 1 has listed the position and output of the gas sensors at each step. The output of a gas sensor shown here, is the maximum gas concentration value measured by the sensors in a period of 25 sec. This waiting period takes care of the parameter Nmem used in the modified GSO algorithm. It can be observed that the average of the gas sensor outputs increases as the sensors get closer to the source. It can also be seen from the table that the output of Sensor 1 decreases after step 12. This is because of the anemotaxic motion which takes Sensor 1 to the upwind side of the source. Once Sensor 1 crosses over the source its output falls and is pulled back by other sensors which now measure higher concentration values. The following video shows the sensor movement. As can be seen, by the end three of the gas sensors have reached the source location. The sensors have hence successfully located the ethanol source. The wind here is directed from the source to the field along the negative y-direction. These experimental results demonstrate the capability of the algorithm in locating an odor source under real world conditions.